Brian Pellican Murphy
Student of Environmental Science and Geospatial Analysis at Humboldt State University
Geospatial analysis is part of a broader field known as Geographic Informations Systems (GIS). As a student of GIS at Humboldt State University I have learned how to collect and process geospatial data in the form of raster imagery and vector shape files. With this data I can perform geoprocessing and raster analysis to create maps that can be used for practical practical applications by many fields. One emphasis of my studies at HSU is cartography, or the science and art of making maps. Cartography is a bridge between my artistic knowledge and my environmental science background.
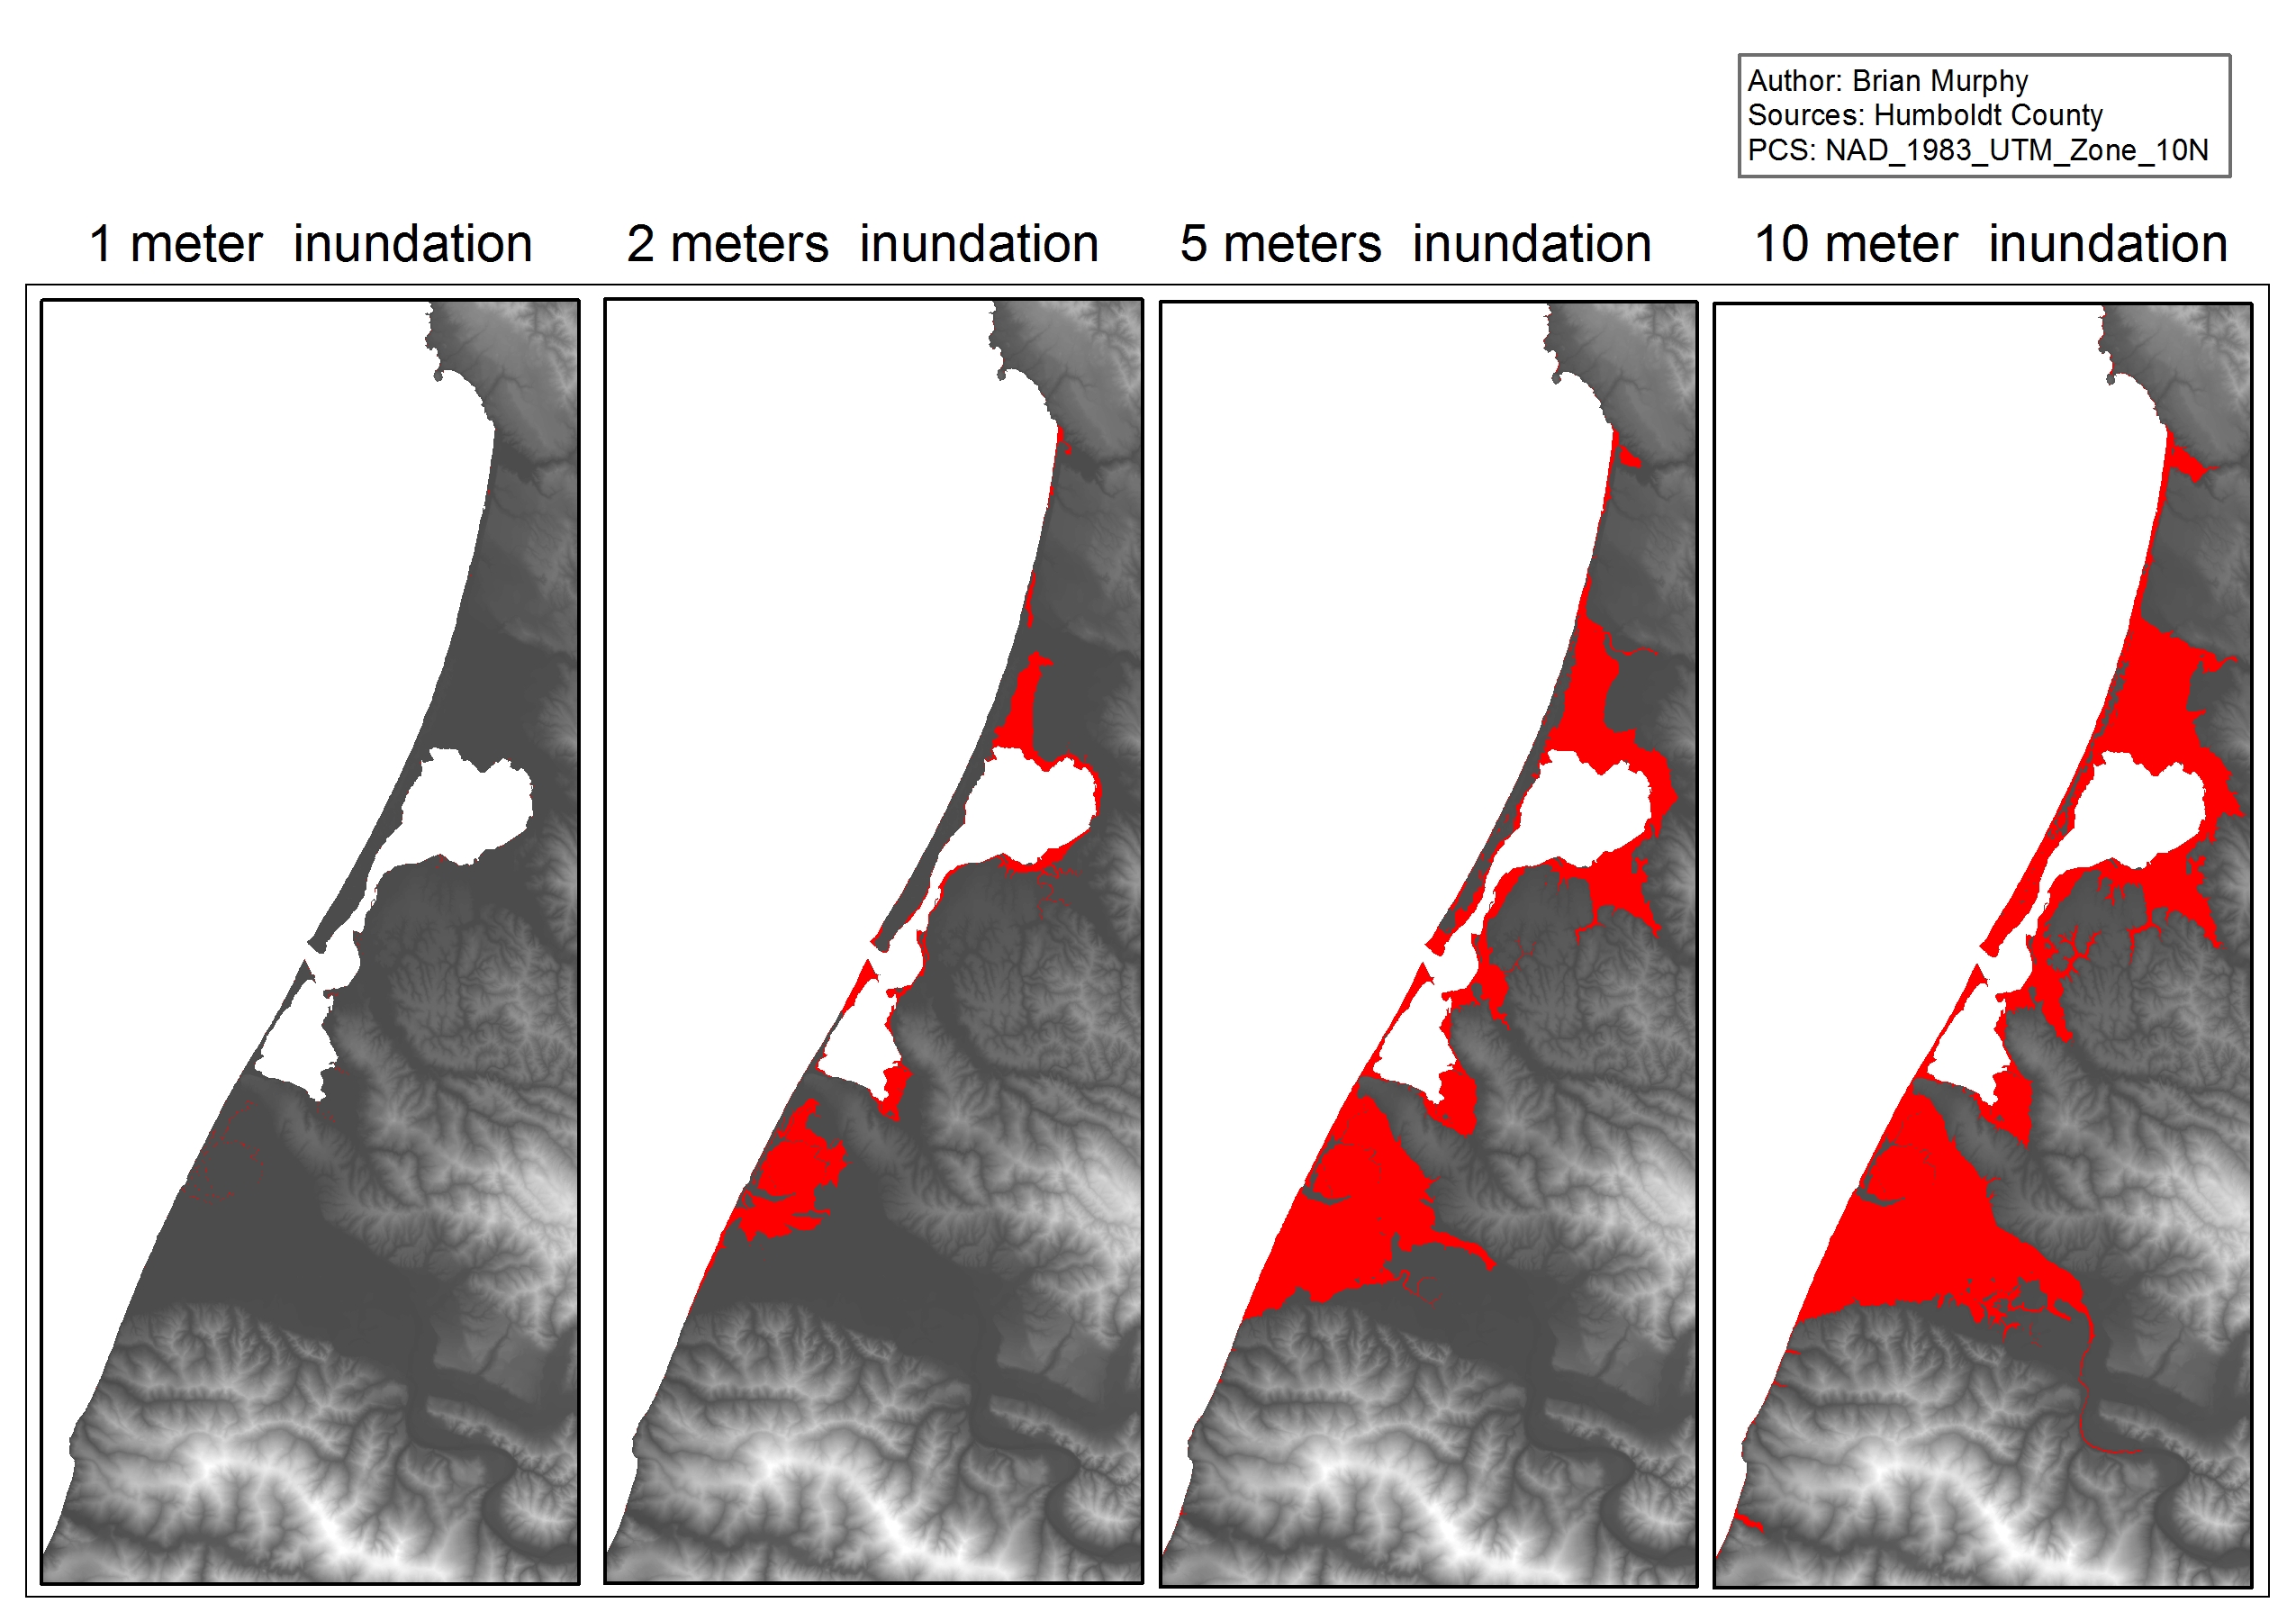
Projected levels of inundation for Humboldt Bay at 4 different levels of sea rise
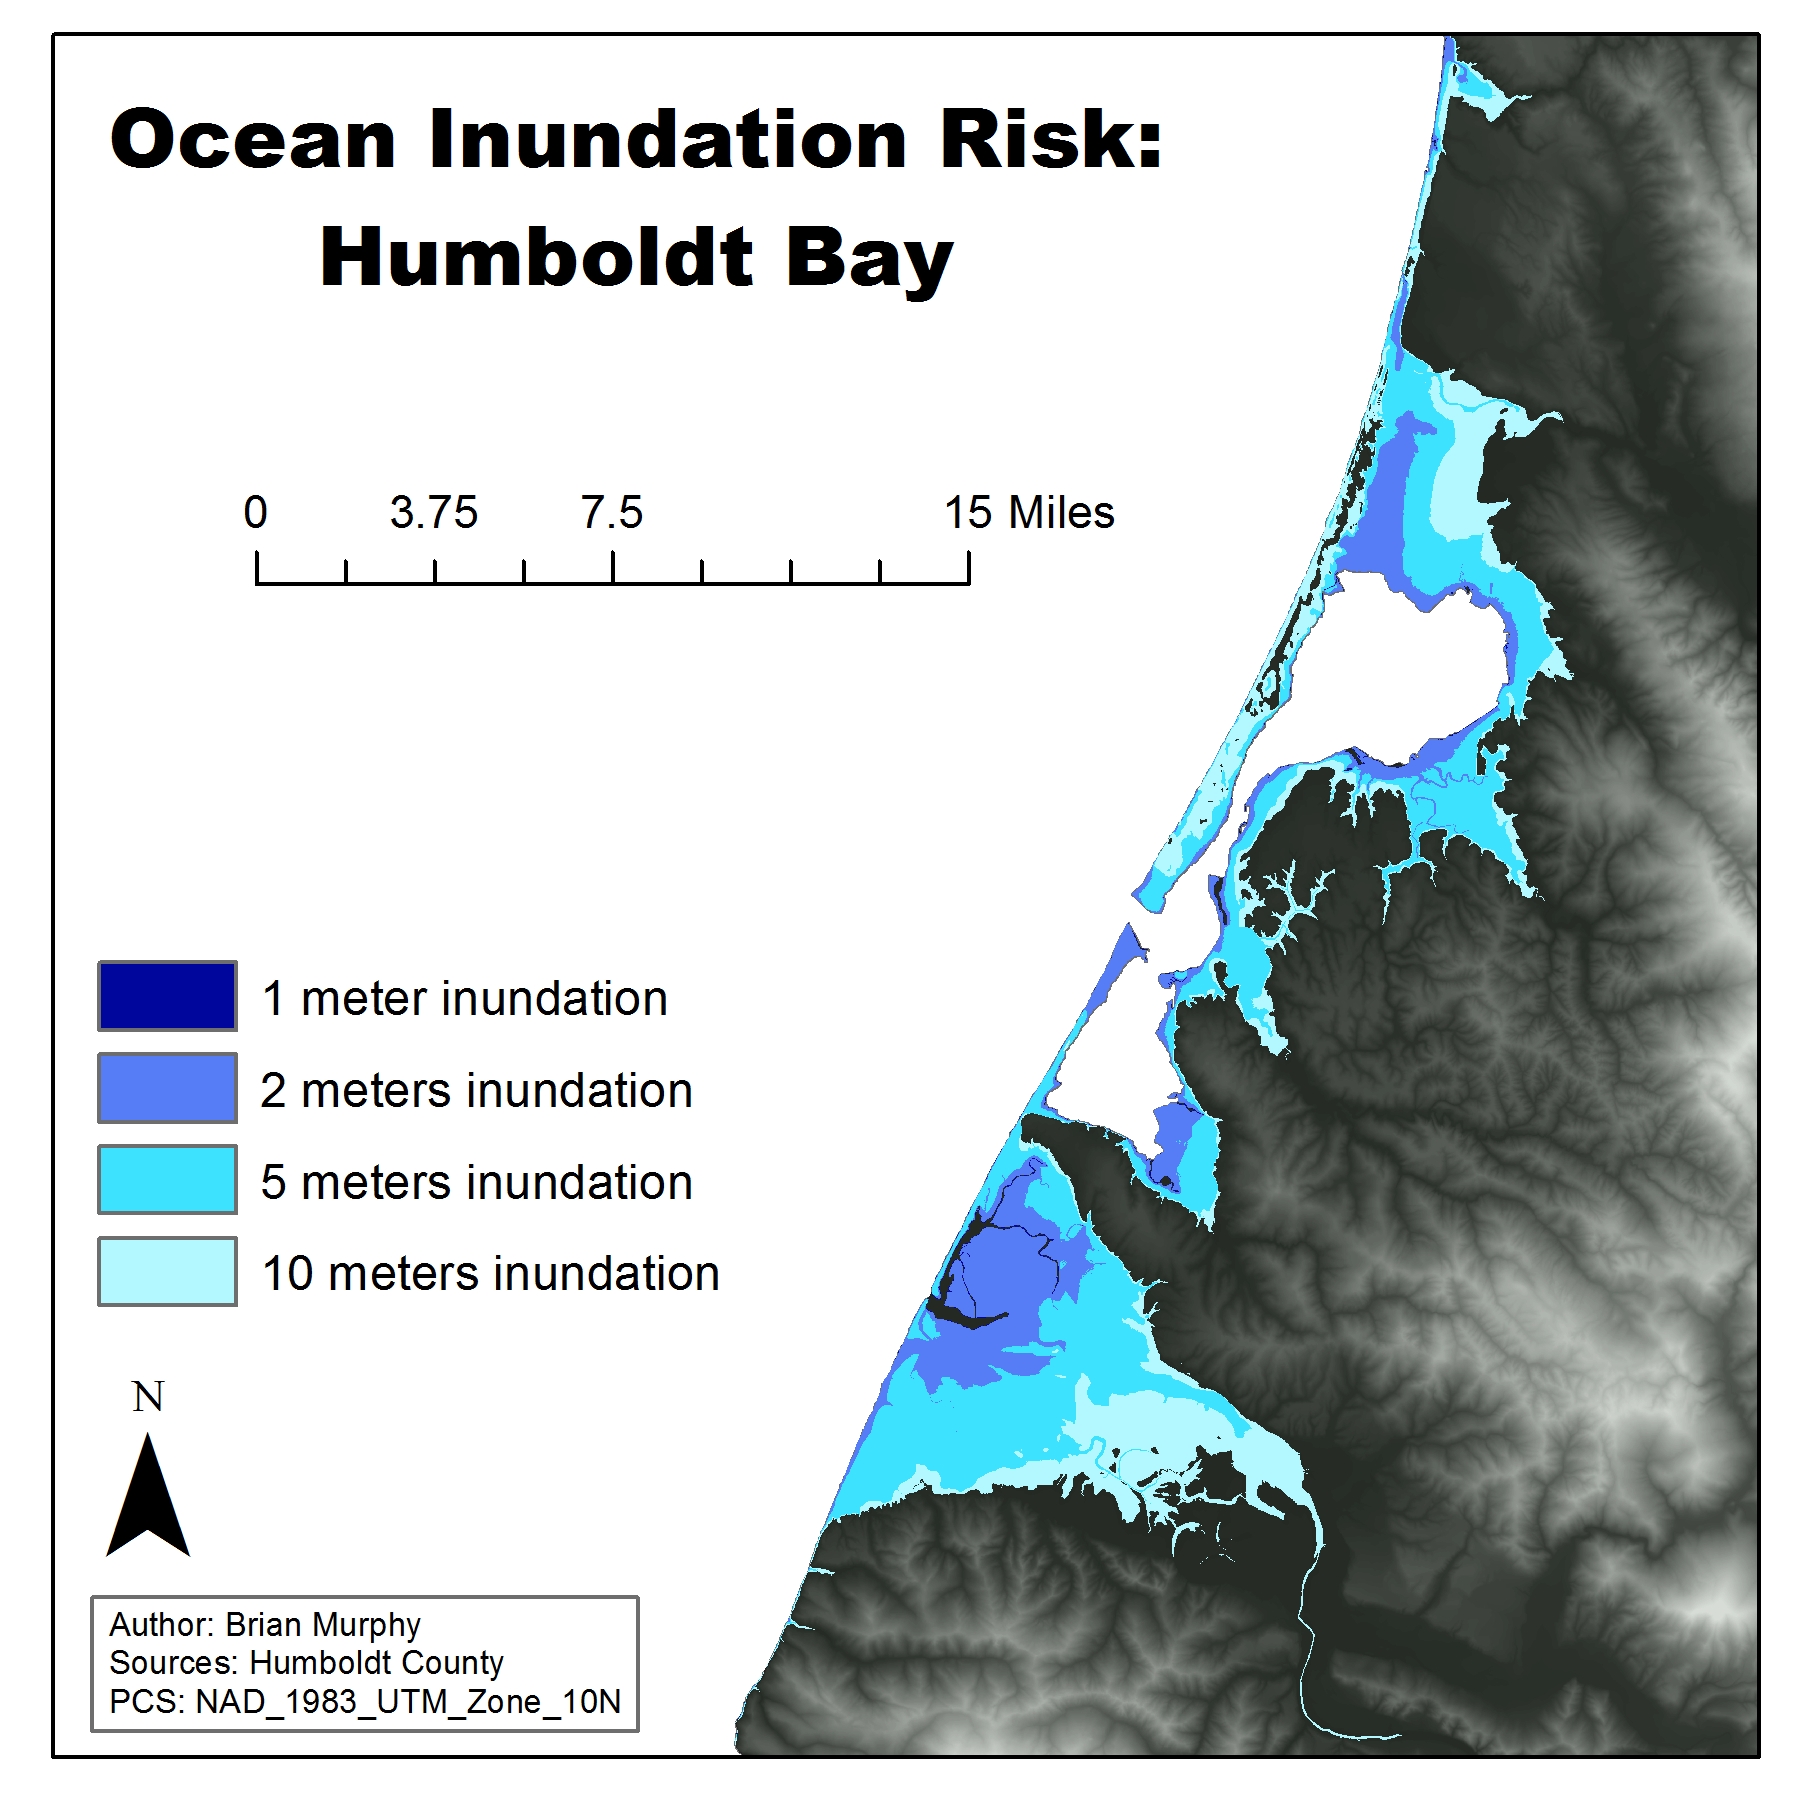
Ocean inundation risk surrounding Humboldt Bay
This was a project performed for GSP 270, Geospatial Analysis, with Professor David Gwenzi at Humboldt State University. The goal of this project was to asses the extent of flooding in the Humboldt Bay region due to the potential effects of human induced climate change. This was done by taking elevation data from a DEM and finding all areas that had a elevation value below the the inundation level.
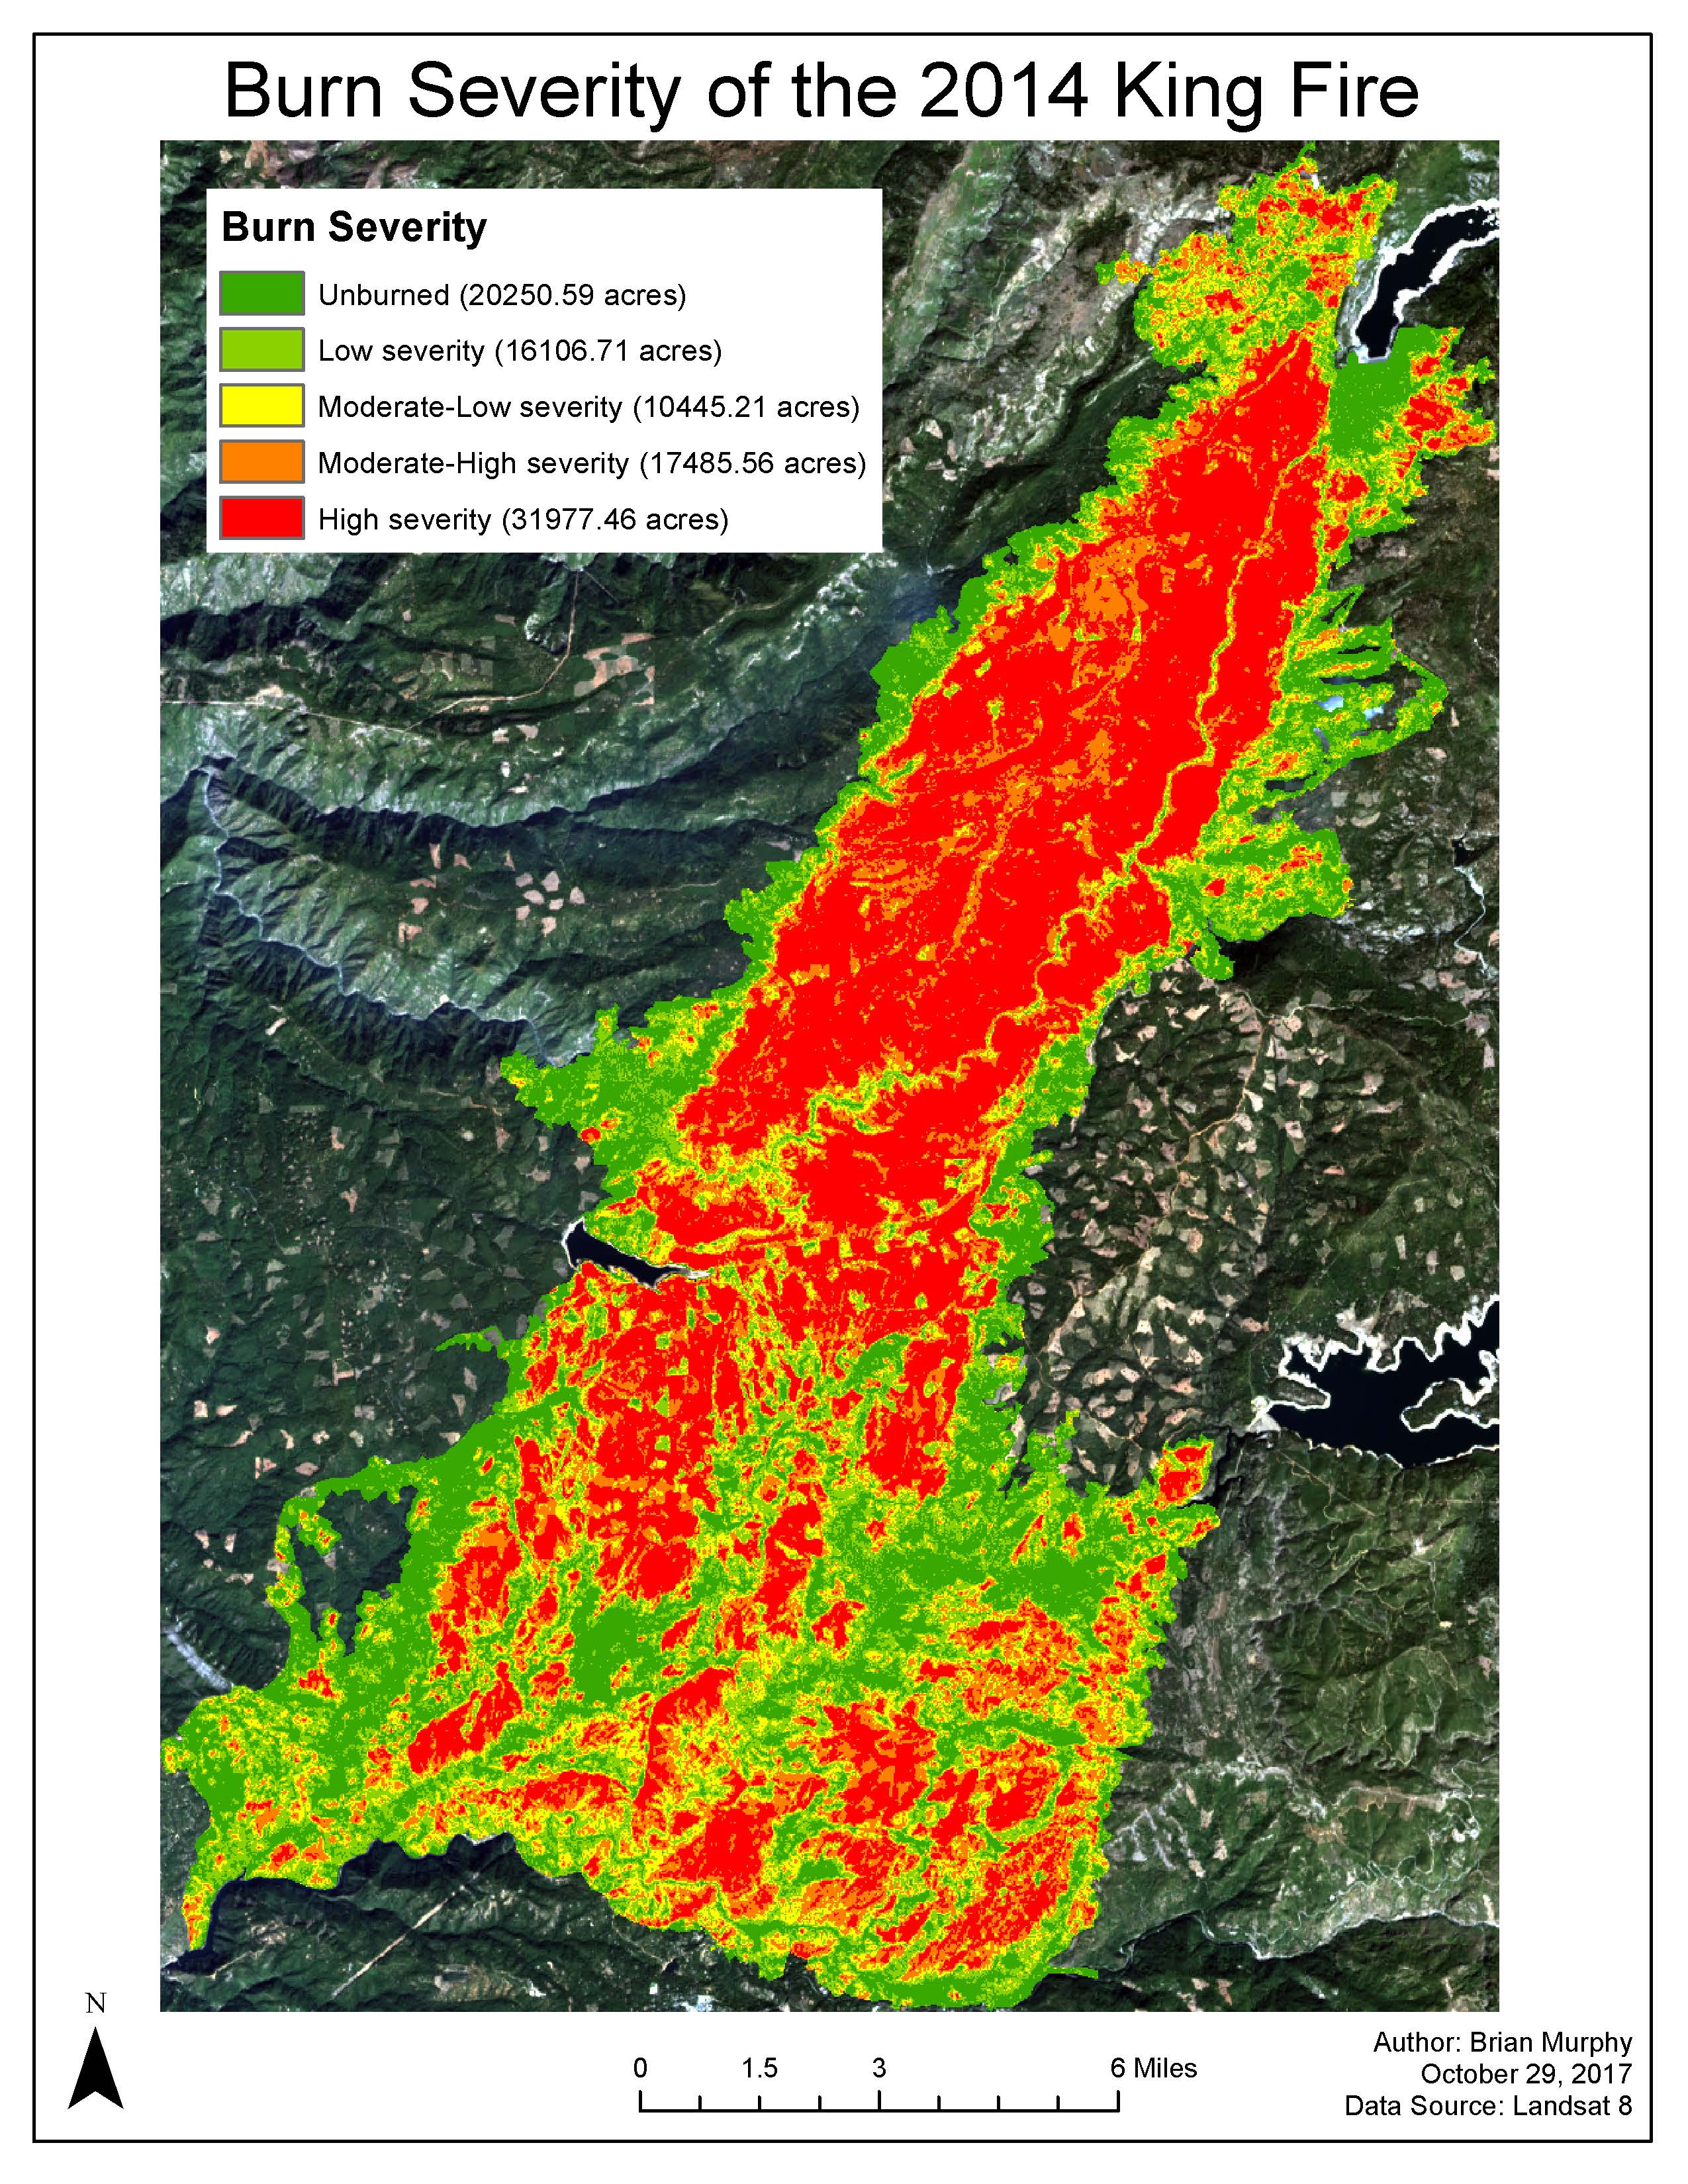
King Fire Burn Severity
Analysis of the intensity and extent of the King Fire which burned 97,000 acres of Ed Dorado County, California in 2014. To acomplish this analysis, the Normalized Burn Ratio (NBR) was calculated. These values were then classified to represent the burn severity. This project was performed for GSP 216, Introduction to Remote Sensing, with Professor Sara Hanna.
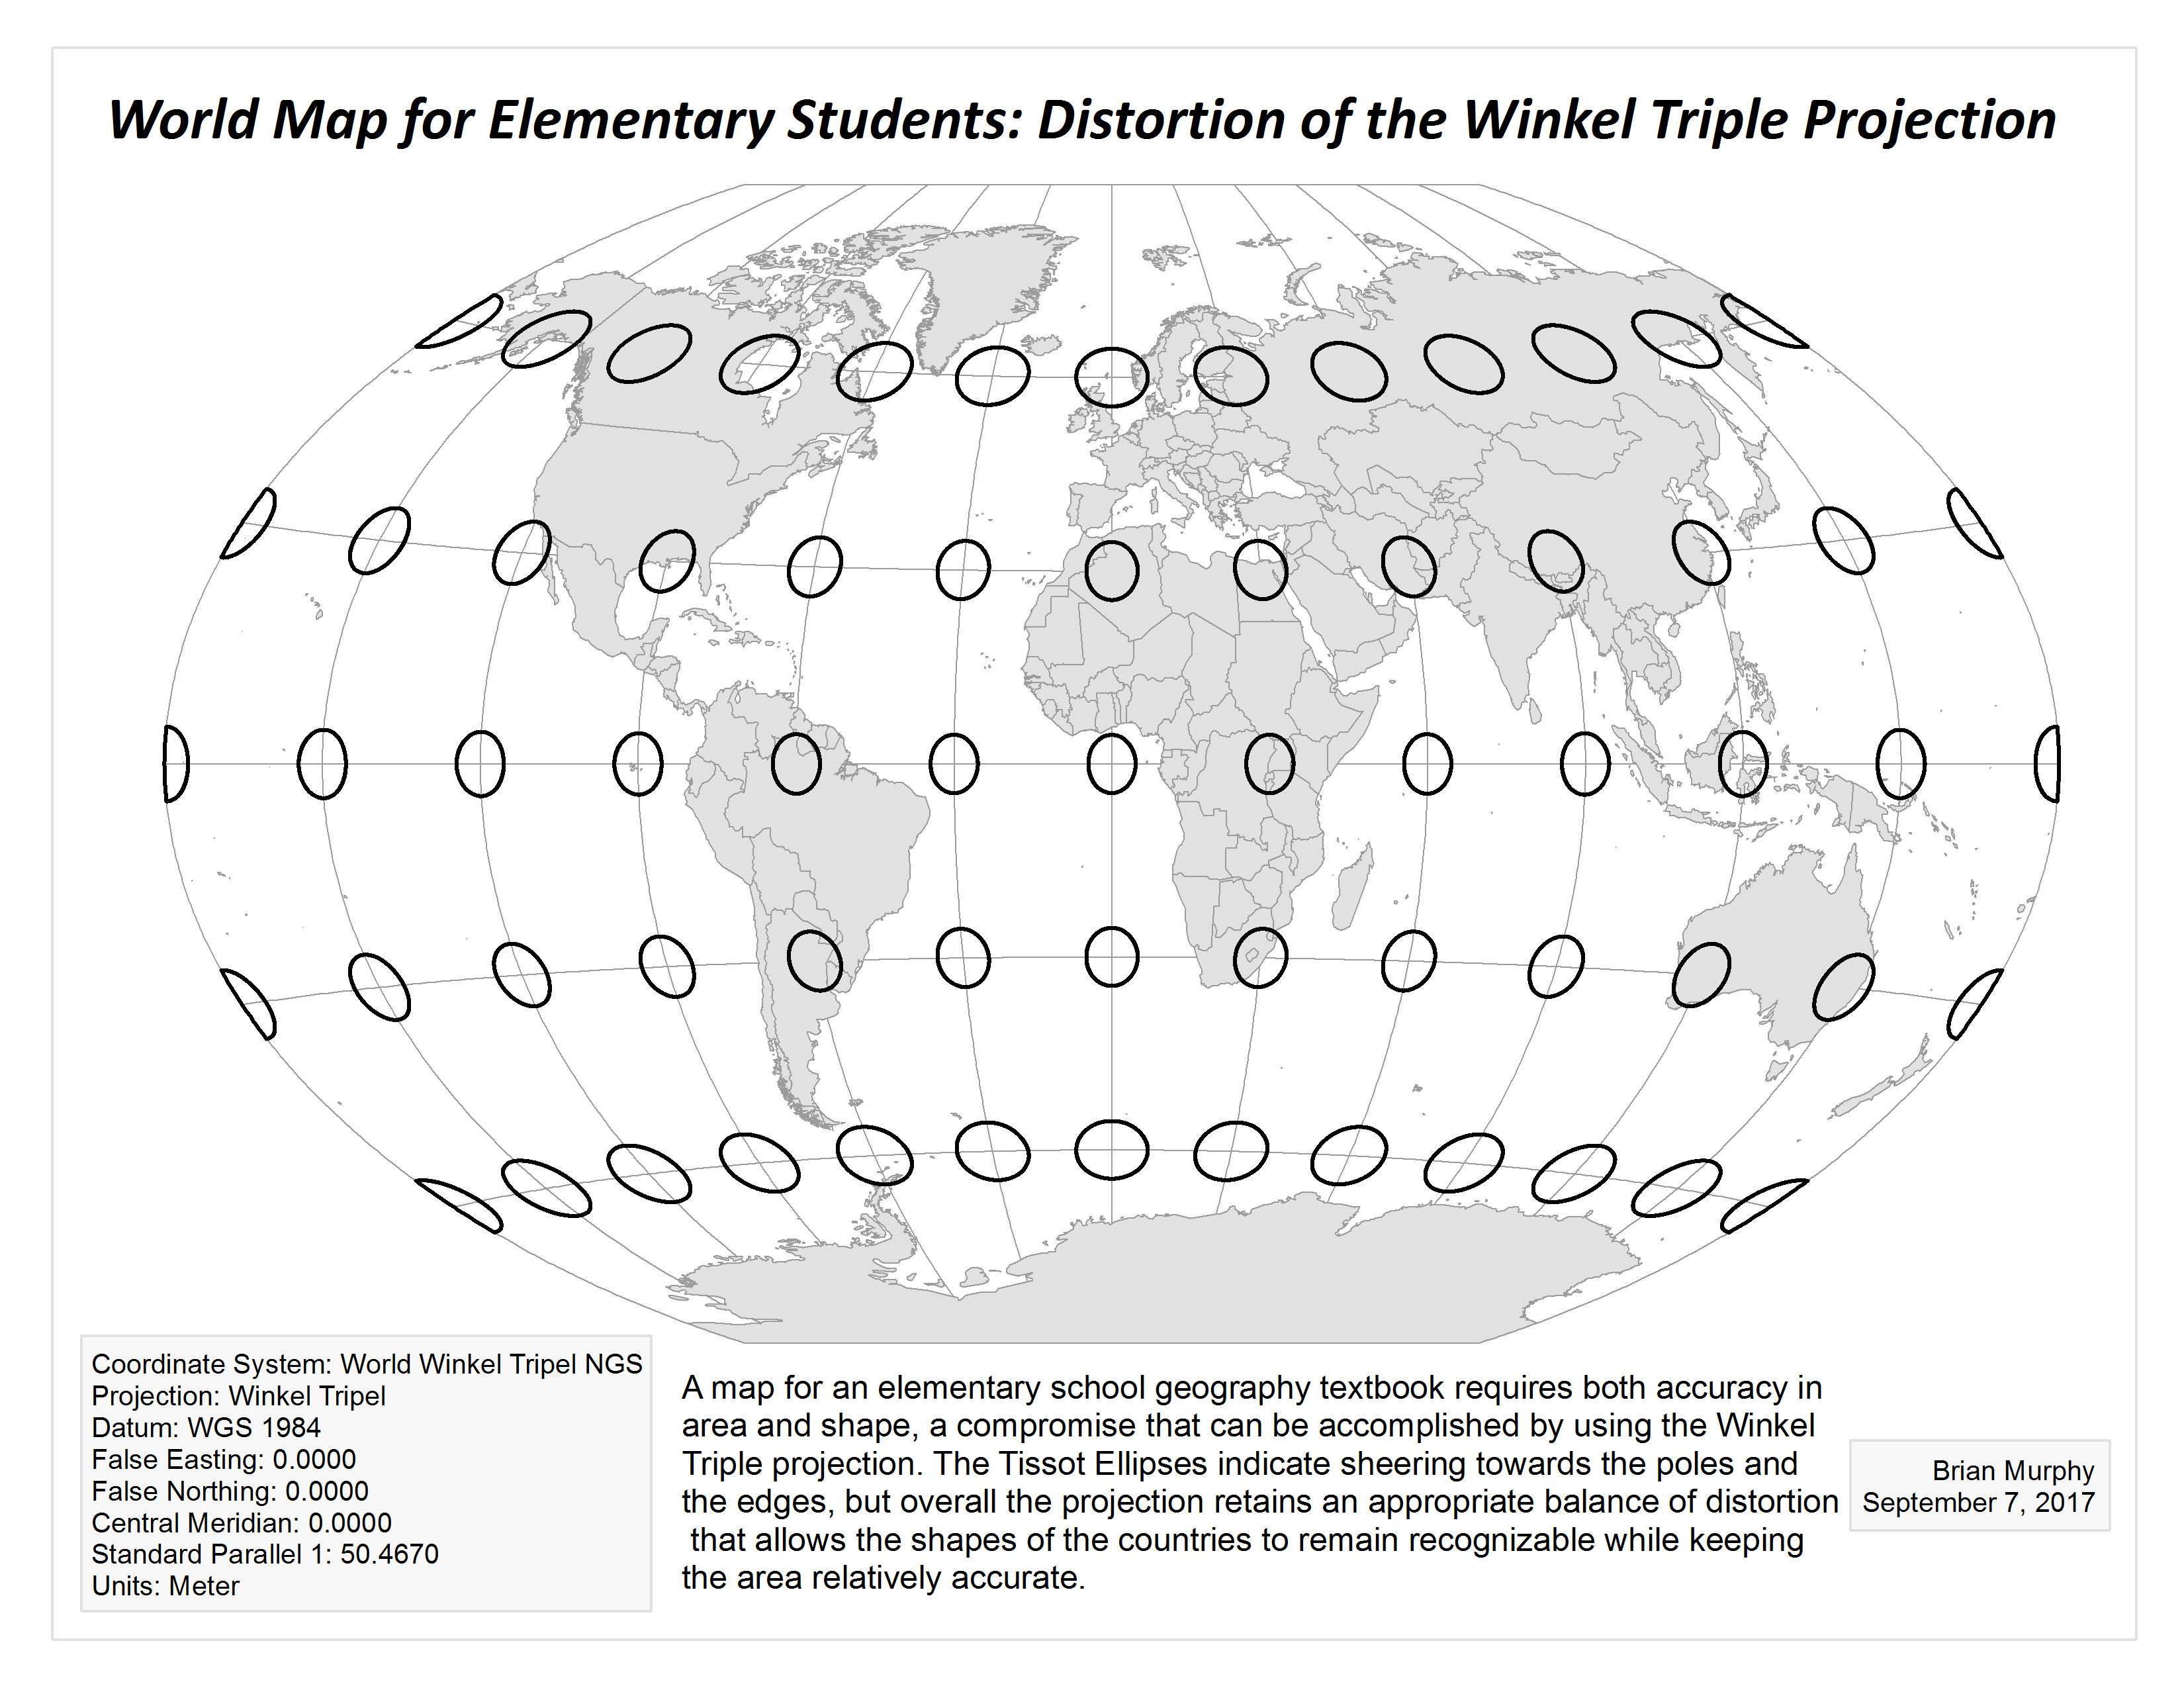
Creating a Map for Elementary Students
In order to create an atlas style map with the least amount of distortion, Tissot Ellipses were used to determine the types of distortion inherint in each map projection. One projection with the appropriate amount of distortin for the maps purpose was the Winkel Triple projection. This project was performed for GSP 316, Cartography, with Professors Amy Rock and Nick Perdue.